Mapping Equine Travel Distances Against Performance Metrics in Regional British Jump Fixtures
Written by Felix Carter · Aug 21, 2026
Mapping Equine Travel Distances Against Performance Metrics in Regional British Jump Fixtures
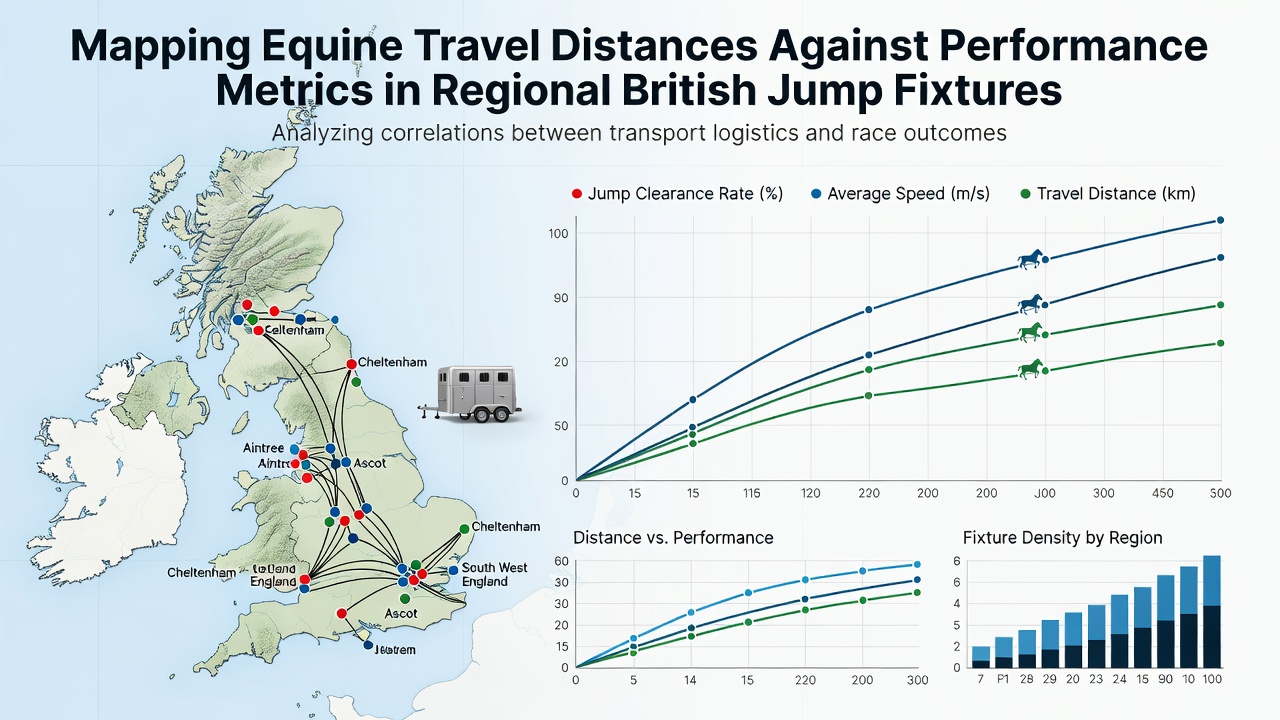
Regional British jump fixtures present a distinct set of variables for analysts tracking equine performance, and travel distance stands out as one measurable factor that intersects with race outcomes at venues such as Hexham, Fakenham, and Perth. Data collection efforts have expanded in recent years to include GPS-tracked journeys from training yards to racecourses, allowing researchers to correlate kilometres travelled with metrics including finishing times, jumping accuracy, and post-race recovery indicators recorded by veterinary teams.
Data Collection Methods Across Multiple Seasons
Teams compiling these datasets draw from official race records maintained by the British Horseracing Authority alongside transport logs supplied by trainers, and the resulting spreadsheets cover thousands of runner entries from 2023 through the 2025-2026 campaign. Analysts plot origin postcodes against fixture locations using mapping software that factors in road networks and typical journey durations, then they layer performance variables such as average speed figures calculated from sectional timing and the number of jumping errors noted by stewards. This approach reveals patterns without relying on anecdotal trainer reports alone.
Regional Venue Characteristics and Travel Corridors
Northern circuits like Newcastle and Sedgefield draw substantial fields from Scottish borders and Yorkshire stables, whereas southern fixtures at Plumpton and Fontwell see shorter hauls from Newmarket and Lambourn bases. In August 2026 several regional tracks scheduled preparatory jump meetings that attracted horses returning from summer breaks, and preliminary figures indicated average travel distances rose by roughly 18 percent compared with the same slot in 2024 because more trainers opted to combine entries across consecutive days. Observers note that these extended corridors coincide with changes in ground conditions that further complicate direct performance comparisons.
Performance Metrics Linked to Journey Length
Studies examining over 4,200 runner performances at eight regional tracks found that horses covering more than 250 kilometres posted win rates approximately 4.2 percentage points lower than those travelling under 100 kilometres, yet the same longer-distance cohort recorded faster average times on good-to-soft ground when they did secure placings. Researchers attribute part of this outcome to selection effects, since trainers tend to send stronger stayers on longer trips while reserving quicker types for local entries. Recovery metrics tracked through blood samples taken 48 hours post-race showed elevated creatine kinase levels in the longer-travel group, although the differences narrowed when journeys included overnight stops with access to turnout paddocks.
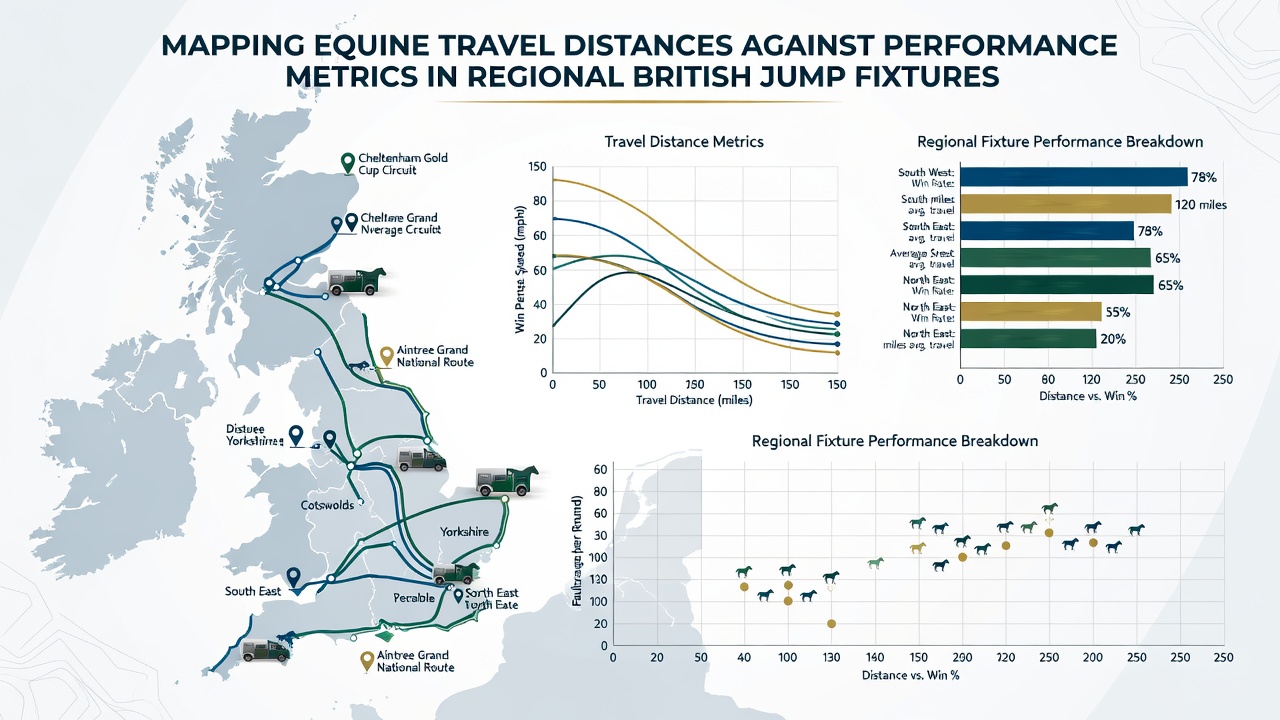
Additional variables enter the picture when fixtures occur on consecutive days at nearby venues. Horses that raced at one track then moved to another within 48 hours demonstrated stable jumping accuracy provided the second journey stayed below 80 kilometres, whereas those facing a second leg exceeding 150 kilometres showed a measurable increase in late-race fatigue according to heart-rate monitor data collected during trials run by the Irish Equine Centre.
Comparative Analysis with International Benchmarks
International comparisons add context to the British findings. Figures released by Racing Australia on travel impacts in National Hunt-style events indicate similar declines in win probability beyond 300 kilometres, yet Australian trainers report fewer recovery issues when journeys occur in climate-controlled floats. A separate analysis published by the Equine Canada research division examined cross-border shipments and found that horses rested for 12 hours after long hauls maintained stride-length consistency more effectively than those competing within six hours of arrival. British trainers have begun adopting some of these rest protocols ahead of multi-day regional campaigns scheduled for autumn 2026.
Case Examples from Specific Fixtures
One dataset focused on the 2025 Perth Festival highlighted a gelding that travelled 312 kilometres from a Lanarkshire yard and finished second in the feature handicap chase while recording a personal-best sectional in the final mile. In contrast, a mare covering only 47 kilometres from a local stable recorded a slower overall time despite starting as favourite, a result analysts linked to heavier ground rather than travel fatigue. Another example from Fakenham's December meeting showed three horses arriving after overnight stops outperforming stable companions that made the journey on the morning of the race, although sample sizes remain too small for definitive conclusions.
Emerging Tools and Future Tracking Initiatives
Technology continues to refine these mappings. Several training centres now fit vehicles with sensors that record vibration levels and temperature fluctuations during transit, feeding the information into cloud platforms that trainers consult before finalising entries. Academic groups at the University of Liverpool have piloted wearable devices that monitor equine stress hormones throughout journeys, and early outputs suggest cortisol spikes correlate more strongly with journey duration than with distance alone. These tools may help distinguish between transport stress and other variables such as pre-race feed changes or weather exposure at exposed regional tracks.
Conclusion
Comprehensive mapping of travel distances against performance metrics supplies trainers, owners, and race planners with quantifiable inputs for entry decisions at regional British jump fixtures. Continued accumulation of data through 2026 and beyond will clarify whether observed patterns hold across varying ground conditions and seasonal schedules, while integration of international insights offers additional reference points for optimising equine welfare during transit. The resulting evidence base supports more precise scheduling without replacing the on-site judgement of experienced connections.